
The Mid-Terms and the Economy
WHAT IS REALLY GOING ON WITH INFLATION?
Here are some of the major inflation numbers from the Bureau of Labor Statistics.
For the 12 months ending August 2026:¹
Headline CPI: 3.4%
CPI excluding energy: 2.5%
Core CPI (excluding food and energy): 2.4%
Energy inflation: 16.3%
Gasoline: +27.4%
Fuel oil: +52.0%
You might not know it from the headlines, but I would characterize the underlying inflation picture as considerably more moderate than the 3.4% headline number suggests. Once the extraordinary increase in energy prices is removed, inflation is running closer to 2.4%–2.5%.
The energy shock associated with the conflict in Iran is having a meaningful impact on the CPI. Energy represents approximately 7.35% of the index, while gasoline alone accounts for about 3.77%.¹
This was particularly apparent in March, when the energy shock first hit the CPI hard. Gasoline prices jumped 21.2% in a single month, accounting for nearly three-quarters of the increase in the overall CPI that month.¹
Bottom Line:
The current 3.4% headline inflation rate makes inflation look considerably hotter than the underlying trend. CPI excluding energy is approximately 2.5%, while core CPI is 2.4%. Both suggest that underlying inflation is considerably more moderate than the headline number.
INFLATION AND THE MIDTERM ELECTIONS
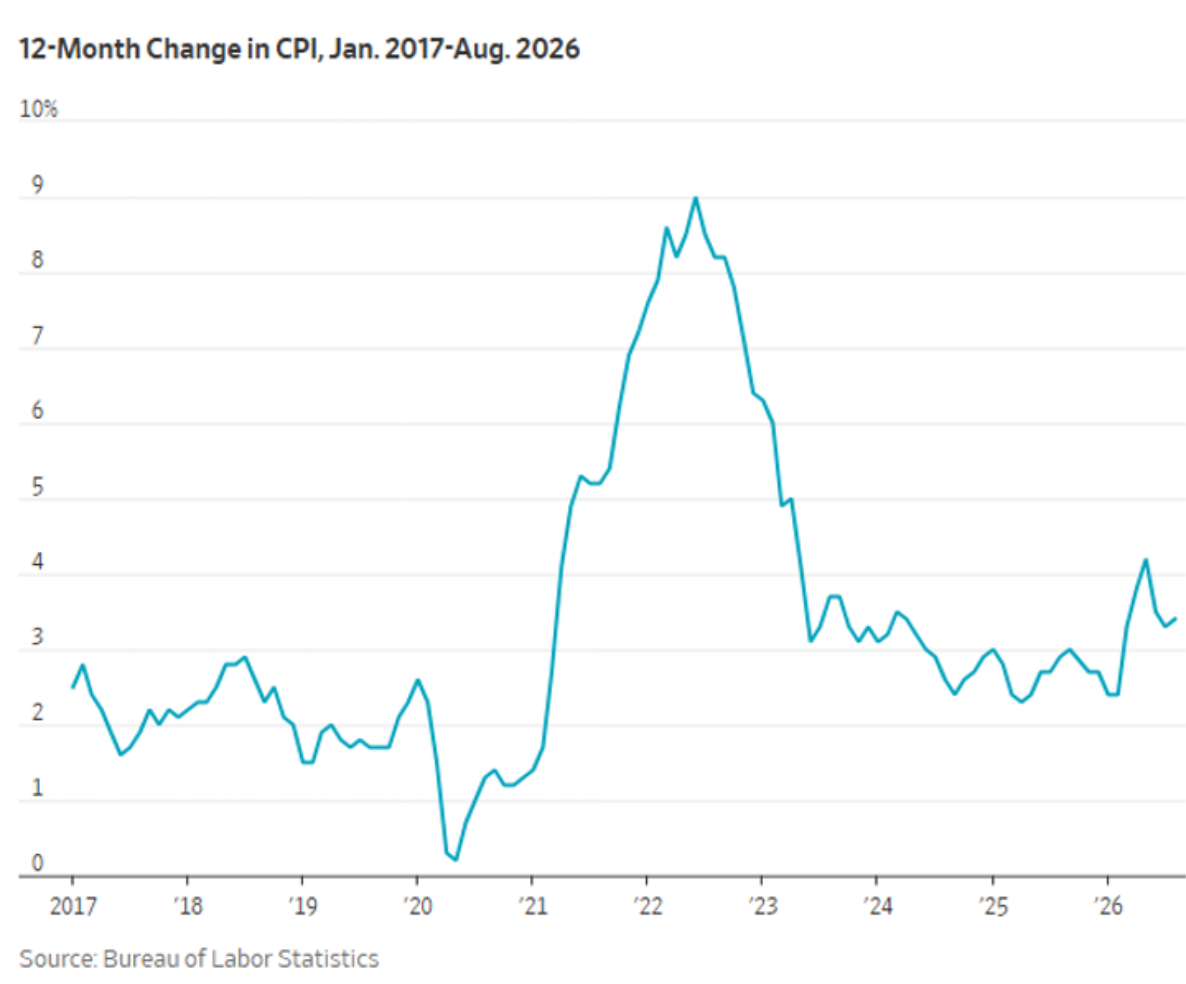
As we approach the midterm elections, inflation and affordability are likely to remain important political issues. Democrats have emphasized affordability and the cost of living, while Republicans have focused on energy, taxes, regulation, immigration, and economic growth.
Issues that dominated earlier elections may also carry different weight today. Ultimately, elections have a way of returning to the famous political slogan: "It's the economy, stupid."
There is an important distinction here, inflation is not the same thing as the price level. Inflation measures how quickly prices are rising. Even when inflation falls back toward 2%, consumers do not necessarily see prices return to where they were several years ago. Instead, prices are generally rising more slowly from an already higher level.
That distinction helps explain why voters can remain frustrated about affordability even when economists point to improving inflation data.
Looking across presidential terms also provides some perspective. Consumer prices increased at a much faster average annual rate during the Biden presidency than during President Trump's first term. Inflation surged following the pandemic and the extraordinary fiscal and monetary response of 2020–2021, before subsequently declining.
Responsibility for that inflationary episode remains politically debated. Both Republican and Democratic administrations approved enormous pandemic-related spending packages, and the Federal Reserve maintained highly accommodative monetary policy well into the recovery. Democrats subsequently enacted the $1.9 trillion American Rescue Plan in March 2021. Economists continue to debate the relative contributions of fiscal stimulus, monetary policy, supply-chain disruptions, labor shortages, housing costs, and energy prices to the inflation that followed.
Housing deserves particular attention because it is both a major household expense and a large component of inflation measures. Home prices increased substantially during the pandemic and its aftermath, aided by historically low mortgage rates, strong demand, limited housing supply, and other factors. Even as inflation has moderated, high home prices and mortgage rates continue to make housing affordability difficult for many Americans.
WHAT ABOUT GASOLINE?
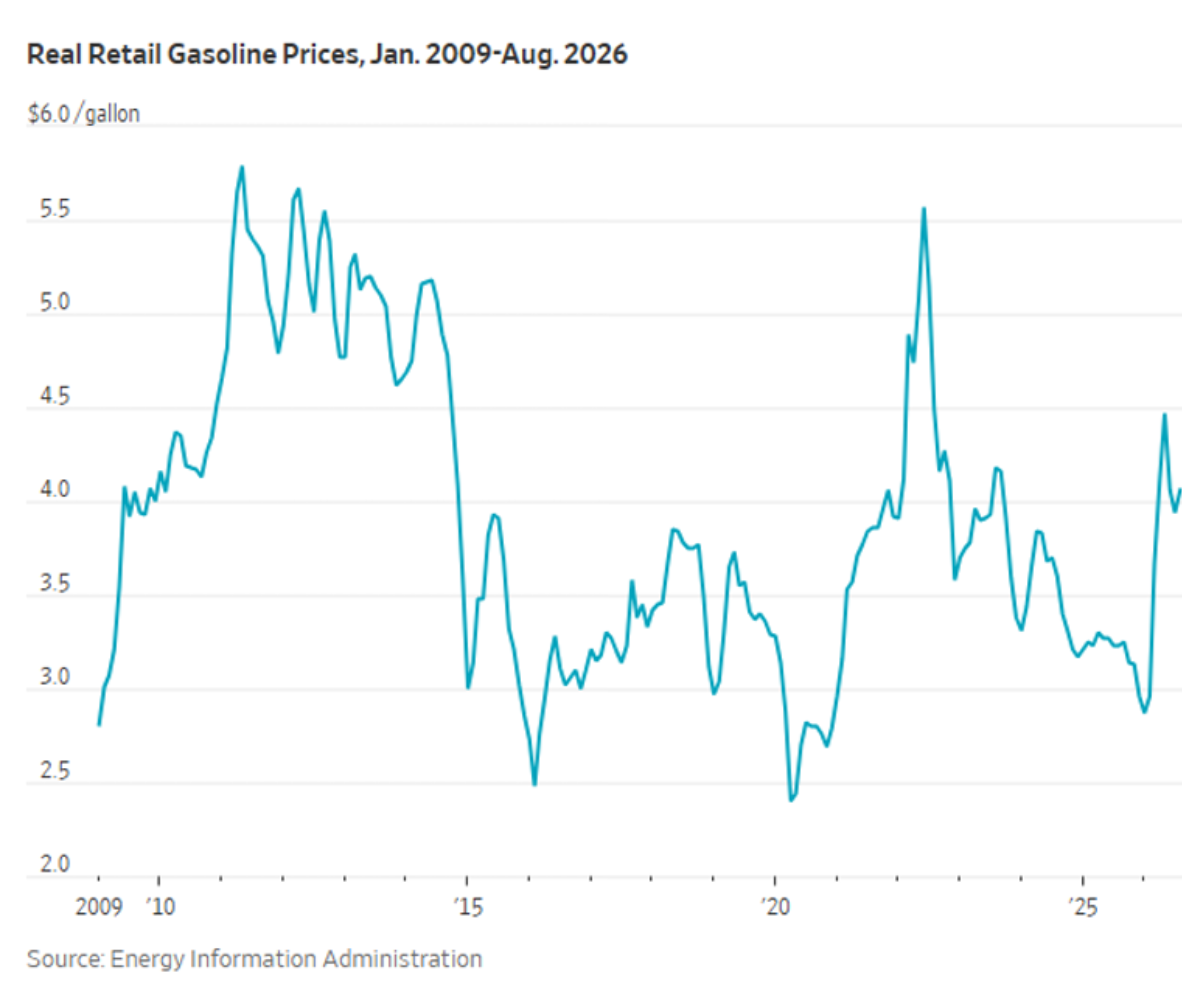
Gasoline prices have risen sharply amid the war in Iran, making energy one of the most visible sources of inflation for consumers. As noted earlier, gasoline prices were 27.4% higher in August than a year earlier, and gasoline alone represents approximately 3.77% of the Consumer Price Index.
Despite the recent spike, some longer-term perspective is useful. The inflation-adjusted average price of gasoline was approximately $3.27 per gallon during President Trump’s first term and $3.89 during the Biden presidency, compared with $3.43 so far during Trump’s second term. The chart below shows the longer-term movement in inflation-adjusted gasoline prices and illustrates just how volatile energy prices can be.
WHAT’S AHEAD IN THE MARKETS?
What a Change in Congressional Control Could Mean
I have received a lot of questions about what impact the midterm elections could have on the stock market. With about six weeks remaining until Election Day, Democrats appear well positioned to make gains in the House, while control of the Senate remains much less certain. The Cook Political Report currently characterizes the Senate as a toss-up, with Democrats projected to gain between one and five seats; they need four for a majority.(3)
If Republicans lose control of one or both chambers of Congress, it would significantly change the legislative environment for the second half of President Trump's term.
Libby Cantrill, head of public policy at PIMCO, has noted that a loss of congressional control would make it more difficult for Trump to advance portions of his legislative agenda. While presidents have considerable executive authority, executive actions cannot substitute for Congress in changing federal law and can also face judicial challenges.(4)
Democratic control of the House would also bring increased congressional oversight and subpoena authority. Control of the Senate would have the additional consequence of giving Democrats control over committee agendas and making confirmation of Trump's nominees—including judicial, Federal Reserve and other executive-branch appointments—considerably more difficult.
At the same time, divided government does not necessarily mean that nothing gets accomplished. Areas such as housing, permitting and other issues with bipartisan constituencies could still provide opportunities for compromise.
Even if Democrats were to control both chambers, their ability to enact major changes would remain constrained. President Trump would retain veto power, and most major Senate legislation would still require 60 votes to overcome a filibuster. As a result, either a Democratic House with a Republican Senate or Democratic control of both chamber could produce a period of significantly greater legislative gridlock.
One area worth watching from an investment standpoint is AI and data-center development. Growing concerns about electricity costs, power availability, infrastructure requirements and the local impact of large data centers have already become political issues. Greater congressional scrutiny could add another layer of uncertainty, although many of the most immediate permitting and development decisions occur at the state and local levels. Schwab also notes that AI remains an important market theme, but that earnings, valuations and broader economic conditions may ultimately matter more to markets than the election itself.
WHAT HISTORY TELLS ABOUT MIDTERMS AND MARKETS
From an investment standpoint, the historical record is more interesting than the partisan outcome.
When one party begins a presidential term controlling the White House and Congress, and subsequently loses one or both chambers in the midterms, investors sometimes assume that divided government will either help or hurt stocks. The historical evidence suggests something different: the reduction in political and policy uncertainty following the election has generally mattered more than which party gained control.
According to Charles Schwab, since 1974 the S&P 500 has averaged just 1.7% from August 1 through Election Day. In the three months following midterm elections, however, the index has averaged 5.7%, with 11 of 13 periods positive. Over the subsequent six months, the average gain has been 12.4%, with all 13 periods positive. These figures represent price returns and, of course, past performance does not guarantee future results.5
Fidelity finds a similar longer-term pattern. Since 1938, the S&P 500 has produced a positive return in approximately 95% of the 12-month periods following midterm elections, with an average return of roughly 14%. Importantly, Fidelity cautions investors against trying to position portfolios based upon which party they expect to win. Historically, the
WHAT THAT COULD MEAN FOR THE REMAINDER OF 2026
Markets began 2026 by continuing the strong advance from 2025, before dropping sharply following the outbreak of the Iran war in March and April. Since then, the Dow has largely moved sideways, trading in a range of roughly 51,000 to 54,000. The market rose in June, declined in July, advanced again in August, and finished September near the lower end of that recent range.
History suggests that continued volatility ahead of the election would not be unusual. It also shows that the months following midterm elections have historically been favorable for equities. That pattern has occurred under a variety of election outcomes and should not be interpreted as evidence that a Democratic or Republican victory itself causes stocks to rise.
If Democrats gain control of the House, Washington would move toward divided government for the final two years of Trump's term. If Democrats also gain the Senate, the implications would extend further into oversight, confirmations and the legislative process. Either outcome could reduce the likelihood of major new legislation passing without bipartisan support.
For investors, however, the more important takeaway may be simpler: once the election is over, one significant source of uncertainty disappears. History suggests markets have often responded favorably to that increased clarity, regardless of which party won. From there, corporate earnings, inflation, interest rates, Federal Reserve policy and the Iran conflict are likely to be more important drivers of market returns than the composition of Congress.
TACTICAL ASSET ROTATION STRATEGY (TARS) RESULTS
THE CORE STRATEGY
The Core ETF Strategy is comprised of 3 of the following 6 asset classes: U.S. Stocks, International Stocks, Real Estate Stocks, Gold, US Bonds and Cash (1-3 mo Treasuries). They are evaluated on a relative-strength basis and re-ranked 1 through 6 each month. Clients are in the top 3. Typically, the CORE makes up 30% of a client portfolio. The Core TARS portfolio is designed to share in some of the bull market’s gains, while minimizing (or even preventing) losses during bear markets. “Win by not losing.”
September was a tough month for most asset classes. Large company U.S. growth stocks, emerging markets stocks, and commodities were the few shinning stars. The Core Strategy was down -3.50% for the month. Real Estate stocks were down, but Gold, which we moved out of two months ago, was down even worse.
The culprit for most assets struggling were rapidly rising interest rates. This hit bonds hard, as well as other assets where the direction of yields matters a lot: real estate, gold, and certain types of equities. Only large growth stocks advanced for the month.
Since April of 2023, the TARS Core Strategy has only recommended Cash or a total of four months. That was the same time we moved to Schwab. It is often seen a risk-off “danger” signal due to the way our models are structured.
However, at the same time, we are in U.S. Growth Stocks (SPY & SPYG) and International Stocks—neither of which is a flight-to-safety. This move seems to be more centered around all things interest-rate-related. Bonds and real estate are both getting pounded by higher rates, and even gold is struggling against their rapid rise. Gold pays no yield and therefore competes for investor dollars when other investments pay higher interest. With those three assets struggling, this month’s move to cash is primarily about distress in the non-stock markets.
Our cash position is SGOV, which is 0-3 month U.S. Treasuries, yielding 3.74%.
Here was the performance of the Core ETFs for September(7)
US Stocks (SPY) - 0.33%
Russell 1000 Value (VONV)** - 3.13%
International (EFA) - 3.31%
Real Estate (USRT) - 5.47%
*Conservative, Moderate Conservative & Moderate allocations hold 50% SPY and 50% VONV.
**Moderate Aggressive & Aggressive allocations hold 0% SPY and 100% VONV.’
There are two changes for October. Sell Real Estate (USRT) and Buy Cash (SGOV). Sell Russell 1000 Value (VONV) and Buy US Stocks (SPY or SPYG).
SECTOR ETFS
The TARS Sectors that are chosen based upon the same momentum strategy as the Core ETFs. I evaluate 85 Sectors and we make changes if they fall out of the top quartile.
Biotech had a tough September but remains in the middle of the top quartile of the list of 90 sectors we track.
Here is the performance of the Sector ETFs for September(7)
Biotechnology (XBI) - 2.97%
*Moderate and Moderate Aggressive allocations
There are no changes for October.
WORLD ETFS
I evaluate 64 country and world ETFs. Aggressive portfolios hold a 7% allocation to 2 country ETFs and Moderate Aggressive have a 2.5% allocation each.
World funds were mixed in September. Emerging Market ex-China (EMXC) was up 0.86% for the month and Austria (EWO) was down -3.36%. Both continue to rank in the top quartile of all country/redion ETFs we track.
Here is the performance of the World ETFs for September(7)
Austria (EWO) - 3.36%
Emerging Market ex-China (EMXC) + 0.86%
There are no changes for October.
OTHER FUNDS
Steady VYM took a hit in September with three of its biggest holdings (Broadcom, JP Morgan, and Johnson & Johnson) having negative returns for the month. Paradigm Select on the otherhand, had an outstanding month with a +2.43% return.
Here is the performance of these funds for September(7)
Vanguard High Dividend Yield Stock Fund (VYM)* - 4.76%
Paradigm Select Fund (PFSLX)** + 2.43%
*Conservative, Moderate Conservative, Moderate & Moderate Aggressive allocations hold VYM.
** Moderate Aggressive & Aggressive allocations hold PFSLX.
There are no changes for October.
FIXED INCOME ETFS
PAAA (PGIM’s AAA Ultra Short Bond Fund) makes 20% of Conservative allocations, 10% of Moderate Conservative and Moderate allocation, and 5% of Moderate Aggressive allocations. It has a current yield of 5.18%. FLOT floating rate has a 10% weighting in Conservative allocation. The PIMCO Income Fund (PIMIX) makes up 10% of all but the Aggressive Growth allocations. For Moderate Conservative and Moderate allocations, FLOT has been swapped out for the Guggenheim Macro Opportunities Fund (GIOIX). For those in non-retirement accounts where we are seeking to limit taxable income, I have substituted the Short-term Nat’l Muni (SUB), North Square Tax-Advantaged Professional Income (QTPI), and PGIM Ultra Short Muni (PUSH).
Here is the performance of the fixed income funds in September(7)
PGIM AAA Ultra Short Bond (PAAA) + 0.33%
PGIM Short Term Muni (PUSH) - 0.87%
Short-term Nat’l Muni (SUB) - 1.34%
Invesco Floating Rate (FLOT) + 0.36%
Guggenheim Macro Opportunities (GIOIX) - 1.56%
PIMCO Income (PIMIX) - 3.29%
North Square Tax-Advantage Income (QTPI) - 1.76%
ALTERNATIVE HOLDINGS
The JP Morgan Equity Premium fund (JEPI), writes covered calls on S&P 500 holdings for additional premium returns yields 7.97%. Real Asset Allocation (RAA) is a diversified asset allocation fund that utilizes the same relative strength strategy as our Core Strategy with the inclusion of not just stocks, bonds, and gold, but commodities, metal miners, managed futures, Bitcoin, TIPS, Emerging Market Bonds, and more. RAA is currently 10-20% of every risk strategy. It has been a solid holding up 9.81% YTD.
Commodities have been a great diversifier and performer for Upgrading since being added as an inflationary environment ahead. Today, there’s little debate that’s what has unfolded. Commodities
Here is the performance of the alternative funds in September(7)
Real Asset Allocation (RAA)* - 1.48%
JP Morgan Equity Premium (JEPI)** - 1.59%
Oberweis Micro-Cap (OBMCX)*** + 1.96%
*All portfolio allocations hold RAA
**All portfolio allocations except for Aggressive hold JEPI
***Aggressive Growth allocations hold OBMCX
There are no changes for October.
REFERENCES
1. U.S. Bureau of Labor Statistics, Consumer Price Index News Release – Sep 2026 MOB Results
2. MarketWatch, “Fuel Prices keep rising – and so do Democrats chances of winning both the House and Senate, Victor Reklaitis, Sep. 23, 2026
3. The Cook Political Report, Jessica Taylor: Six Weeks Out From Election Day, Here’s our Senate Outlook, Sep. 24, 2026.
4.. Barron’s, “Why the Midterm Elections Matter for the Stock Market this Year, Naomi Buchanan, Sept 29, 2026.
5. Schwab Brokerage, “What the 2026 Midterms could Mean for the Market,” August 17, 2026
6. Fidelity, “How Might Midterm Elections Impact the Stock Market?” August 11, 2026.
7. Morningstar September 30, 2026 Monthly Returns.
DISCLOSURES
The analysis and commentary in this Market Commentary is general in nature and does not take your personal circumstances into consideration. It is not intended to be a substitute for specific, individualized financial advice and investors should obtain legal, accounting and tax advice from a qualified tax professional, accountant or attorney.
The information provided in this Market Commentary, including any strategies, methodologies, and opinions, is expressed as of the date hereof and is subject to change. EverSource Wealth Advisors, LLC assumes no obligation to update or otherwise revise these materials.
This Market Commentary relies upon historical data, and much of the information presented is not intended to be performance reporting or representation, whether hypothetical or actual. Reports on the performance of various strategies are gross, not net, and do not take into account our fee or various third-party charges such as trading charges. Individual Exchange Traded Fund (ETF) performance in the commentary are monthly returns of all ETFs utilized across client accounts in various asset allocation percentages based upon risk tolerance. They are gross returns and not net of advisory fees. Each client’s returns will vary based upon the percentage of each ETF held, in addition to other variables, such as: allocations to money market funds, additional individual stocks or mutual funds held, and date of entry into each holding.
Actual results will vary from the analysis. Past performance should not be taken as an indication or guarantee of future performance, and no representation or warranty, expressed or implied is made regarding future performance or the accuracy of the information herein.
This material is provided for informational purposes, is intended for your use only, does not constitute an invitation, solicitation, or offer to subscribe for or purchase any of the products or services mentioned. It is likewise not a recommendation that you purchase, sell, or hold any security or other investment or pursue any investment style or strategy.