
America at 250
As America celebrates its 250th birthday this July, investors have an opportunity to look back at another milestone year—the nation's Bicentennial in 1976. While the country was wrapped in patriotic celebrations, the economic backdrop was anything but festive. President Gerald Ford was leading a nation recovering from the Watergate scandal, the end of the Vietnam War, and the painful inflation that followed the 1973 oil embargo. The term "stagflation" (high inflation combined with weak economic growth) had become part of every investor's vocabulary.
Those of us in the “Boomer” category can probably remember where we were in 1976, and how we celebrated the Bicentennial. My contrarian father decided we would “beat the crowds” by visiting Washington, D.C., in the summer of 1975. Then, in the summer of 1976, he took us to Europe, where we visited 12 countries, including Yugoslavia and East Germany—two nations that no longer exist.
The cost of living during these two milestone celebrations tells an interesting story. In 1976, gasoline averaged about $0.59 per gallon, a new car cost roughly $5,700, a loaf of bread was about $0.32, a gallon of milk was around $1.68, and the average 30-year mortgage rate was approximately 8.87%. Fifty years later, Americans are paying about $3.50 for gasoline, more than $40,000 for the average new vehicle, over $2.50 for a loaf of bread, $4 or more for a gallon of milk, and roughly 6.5% for a 30-year mortgage. While inflation accounts for much of the increase, housing, education, and healthcare costs have risen far faster than overall consumer prices.
Today’s economy under President Donald Trump faces a different set of challenges. Inflation has moderated from its post-pandemic highs, but remains a concern. Investors are watching interest rates, government debt, geopolitical tensions, and the rapid advancement of artificial intelligence. Yet corporate earnings remain resilient, unemployment is relatively low, and the stock market continues to trade near record highs despite periodic volatility.
Perhaps the greatest lesson from comparing 1976 with 2026 is that successful investing has never depended on waiting for perfect conditions. In 1976, many investors feared inflation, recession, and political uncertainty. Those who remained invested over the following decades participated in one of the greatest wealth-creation periods in American history.
As we celebrate America's 250th birthday, the parallels are striking. Every generation believes its challenges are unique, yet history reminds us that uncertainty is constant. Patriots in 1776, citizens in 1976, and investors in 2026 all faced significant obstacles. The enduring lesson is that optimism, discipline, and a long-term perspective have historically rewarded those willing to look beyond today's headlines and invest in America's future.
WHAT’S AHEAD IN THE MARKETS?
Probably the biggest issue right now is the on-again off-again war with Iran. Even with a “treaty,” it’s highly unlikely that Iran will abide by it for very long, which means more volatility in the energy markets for the foreseeable future. The U.S. economy still looks like a slow-growth, not recessionary environment. The Fed projections and forecasters are clustered around roughly 2.2% GDP for 2026, with unemployment fairly stable.
The other problem for markets is inflation. The Fed held rates at 3.50%-3.75% in June, but core inflation projections were revised higher, so rate cuts may be harder to get unless inflation cools convincingly.
The market’s biggest support is earnings, especially AI, semiconductors, tech infrastructure, and select cyclicals. Schwab noted the Wall Street analysts now expect about 25% S&P 500 earnings growth for 2026, which is a big upwards revision.1 Based upon this, my base case is that the S&P 500 could be up another 3% - 8% by year-end.
TACTICAL ASSET ROTATION STRATEGY (TARS) RESULTS
THE CORE STRATEGY
The Core ETF Strategy is comprised of 3 of the following 6 asset classes: U.S. Stocks, International Stocks, Real Estate Stocks, Gold, US Bonds and Cash (1-3 mo Treasuries). They are evaluated on a relative strength basis and re-ranked 1 through 6 each month. Clients are in the top 3. Typically, the CORE makes up 30% of a client portfolio. The Core TARS portfolio is designed to share in some of the bull market’s gains, while minimizing (or even preventing) losses during bear markets. “Win by not losing.”
TARS Core had a tough month in June, with an overall - 2.47% return. The poor performer in June was gold. We have been in gold for 28 months now, with a +91% return over that period. For those who owned gold the entire time it was awesome. After two great months this year of +12.36 and
+8.63%, gold dropped four months in a row: -11.01%, -1.49%, -1.57%, and -11.67% in June. So, for anyone who came onboard this year, especially after Feb, it has been a disappointment. Unfortunately, that is how momentum investing can work in the short-run.
Gold peaked late in January at roughly $5,300/oz and has fallen to the roughly $4,000/oz. level recently. Gold may rebound from here or it could take another -10% leg downward, if it acts as it has historically with up to -50% moves after a big rally. Here is a chart showing when we purchased gold in 2024 and today.
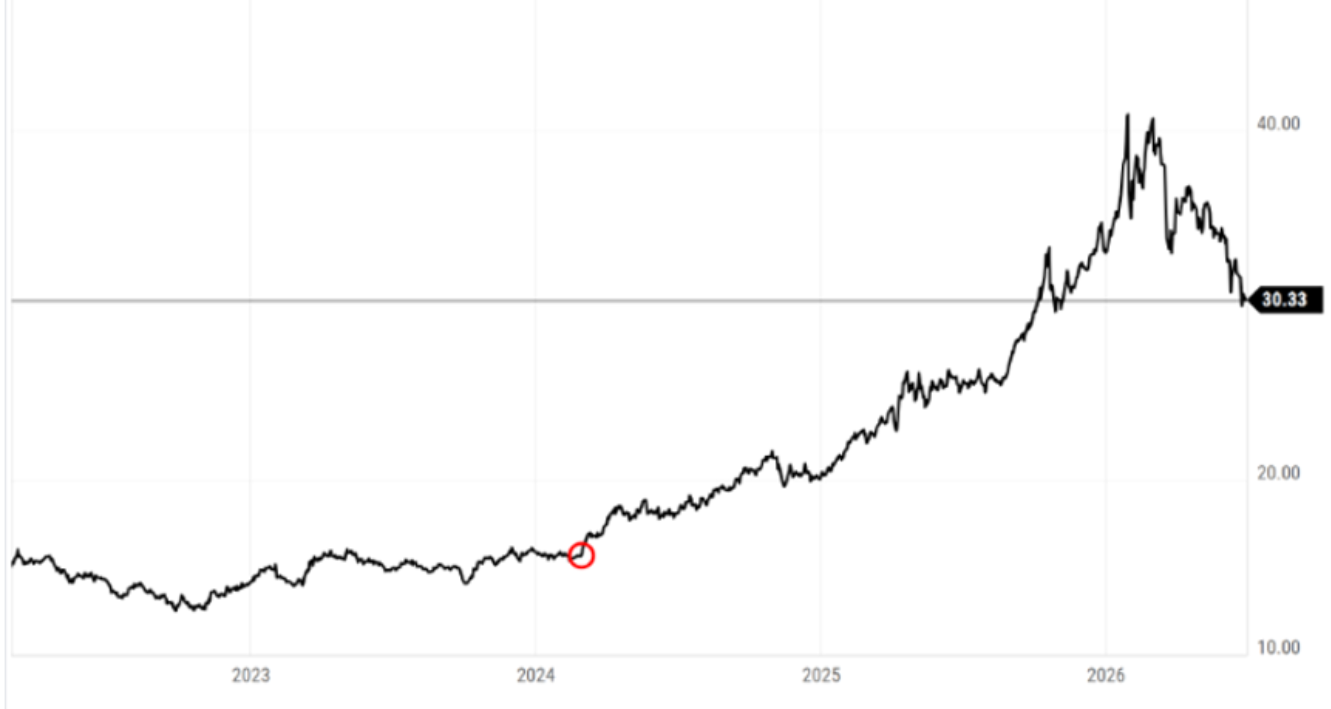
The question might be, why did we wait so long to sell and not sell at the top? As I’ve mentioned in the past, the Tactical Asset Rotation Strategy (TARS) is a math driven, trend-following strategy. In looking at the past 1 month, 3 month, 6 month, and 12 month returns of an asset, we establish momentum for assets going up and down. From the simple graph below, you can see how we typically buy after an asset has hit bottom and is moving up and sell after it has started down and another asset class that is going up replaces it. The goal is to capture a large portion of the return in between.
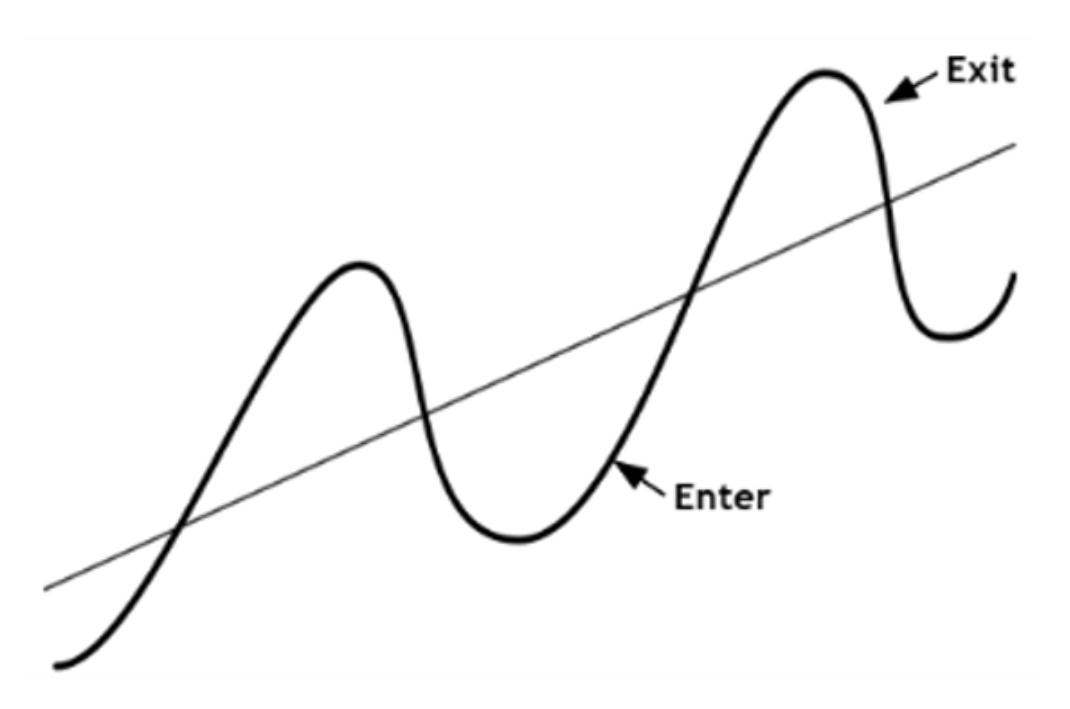
Notice that the enter and exit labels aren’t precisely at the top or bottom of the cycle. That would be ideal, of course. But we recognize that if we’re waiting for the market to tell us its direction has changed, this is by definition going to happen after the trend change occurs.
Naturally, we’d always love to get the buy signal a little closer to the bottom and the sell signal a little closer to the top. But realistically, the process has done a good job of helping us capture the bulk of the gains without suffering through the bulk of the declines. That is a good recipe for building wealth over time, or as we like to say, “winning by not losing.”
In our new allocation within the Core Strategy, if US Equities (SPY) is part of the mix, then we further evaluate the US stock market for which segment is performing best. We rotated into IWO last month, which is the Russell 2000 Growth Index. Conservative to Moderate clients have a 50/50 mix of the two, while Moderate Aggressive and Aggressive allocations are 100% in IWO.
Real Estate is replacing Gold this month. This asset class has only been in favor for one month over the last four years. Real estate has grappled with a number of headwinds, including sharply rising interest rates, as well as the post-COVID, work-from-home movement that has kept office vacancies high. Historically, we have used Vanguard’s Real Estate ETF (VNQ) as our real estate option. In evaluating other options, the iShares Core REIT ETF (USRT) has outperformed VNQ in both the short-term and long-term. In addition, the expense ratio is slightly lower (0.13% vs 0.08%).
The biggest reason for the performance difference is that they track different real estate indexes. The index that Vanguard (VNQ) tracks is broader, including mortgage REITs and some other types that are more sensitive to interest rates. The index USRT track is slightly less interest-rate sensitive, which has helped it as interest rates have crept higher. There's no particular reason to think that dynamic is likely to reverse, so we're inclined to go with the option better suited to the recent/current trend.
Year-to-date the Core ETF strategy is up 6.73% as compared to the S&P 500 up 9.55% and the 60/40 blend index up 9.94%.
Here was the performance of the three Core asset classes for June (2)
US Stocks (SPY) - 1.03%
Small Cap Value (IWN)** + 3.59%
International (EFA) + 0.682%
Gold (IAU) - 1.167%
*Conservative, Moderate Conservative & Moderate allocations hold 50% SPY and 50% IWN.
**Moderate Aggressive & Aggressive allocations hold 0% SPY and 100% IWN.
There is one change for July. Sell IAU (Gold) and Buy USRT (Real Estate) .
SECTOR ETFS
Aggressive Growth allocations were in Aerospace & Defense (PPA), which you would think would do well post-war as the government restocks weapons, but the trend line definitely has PPA out of the top quartile. It will be replaced with Biotechnology as well.
Here is the performance of the Sector ETFs for June (2)
Commodities (PDCD)* - 9.88%
Aerospace & Defense (PPA)** - 0.459%
*Moderate & Moderate Aggressive allocations hold IBT
** Aggressive allocations hold PAA
There is one change for July. Sell Commodities (PDBC)/Aerospace & Defense (PPA) and buy Biotechnology (XBI).
WORLD ETFS
I evaluate 64 country and world ETFs. Aggressive portfolios hold a 5% allocation to 2 country ETFs and Moderate Aggressive have a 2.5% allocation each.
World funds were a bright spot for July. Emerging Market ex-China (EMXC) was up 1.83% for the month and Austria (EWO) was up 4.78%.Both did better than the funds we replaced them with last month.
Here is the performance of the World ETFs for June (2)
Austria (EWO) + 4.78%
Emerging Market ex-China (EMXC) + 1.832%
There are no changes for July.
OTHER FUNDS
VYM continues to be a consistent performer and is doing exceptionally well this year, up +11.26% YTD.
We have been in Aegis Small Cap Value fund since the beginning of the year and had an 8.33% return over that period. Aegis peaked roughly six weeks ago, along with commodities slid out of the top quartile and is being replaced with Paradigm Select (PFSLX). Select is a fairly concentrated small-mid cap fund with a a value tilt.
Here is the performance of these funds for June (2)
Vanguard High Dividend Yield Stock Fund (VYM)* - 0.11%
Aegis Small Cap Value (AVALX)** - 7.17%
*Conservative, Moderate Conservative, Moderate & Moderate Aggressive allocations hold VYM.
** Moderate Aggressive & Aggressive allocations hold AVALX.
There is one change for July. Sell Aegis Small Cap Value (AVALX) and buy Paradigm Select (PFSLX).
FIXED INCOME ETFS
PAAA (PGIM’s AAA Ultra Short Bond Fund) makes up 20% of Conservative allocations, 10% of Moderate Conservative and Moderate allocations, and 5% of Moderate Aggressive allocations. It has a current yield of 5.33%. FLOT floating rate has a 10% weighting in Conservative allocation. The PIMCO Income Fund (PIMIX) makes up 10% of all but the Aggressive Growth allocations. For Moderate Conservative and Moderate allocations, FLOT has been swapped out for the Guggenheim Macro Opportunities Fund (GIOIX). For those in non-retirement accounts where we are seeking to limit taxable income, I have substituted the Short-term Nat’l Muni(SUB), North Square Tax-Advantaged Professional Income (QTPI), and PGIM Ultra Short Muni (PUSH).
Fixed income was a bright spot for June with every fund positive for the month.
Here is the performance of the fixed income funds in June (2)
PGIM AAA Ultra Short Bond (PAAA) + 0.41%
PGIM Short Term Muni (PUSH) + 0.28%
Short-term Nat’l Muni (SUB) + 0.14%
Invesco Floating Rate (FLOT) + 0.35%
Guggenheim Macro Opportunities (GIOIX) + 0.63%
PIMCO Income (PIMIX) + 0.92%
North Square Tax-Advantage Income (QTPI) + 0.16%
ALTERNATIVE HOLDINGS
The JP Morgan Equity Premium fund (JEPI), writes covered calls on S&P 500 holdings for additional premium returns yields 8.45%. Real Asset Allocation (RAA) is a diversified asset allocation fund that utilizes the same relative strength strategy as our Core Strategy with the inclusion of not just stocks, bonds, and gold, but commodities, metal miners, managed futures, Bitcoin, TIPS, Emerging Market Bonds, and more. RAA is currently 10-20% of every risk strategy. It has been a solid holding up 7.89% YTD with less downside risk than the S&P 500 that is up 9.55%.
Commodities seem to have run their course and the SummerHaven Dynamic Commodity fund (SDCI) in Aggressive accounts is being replaced by the Oberweis Micro-Cap (OBMCX) fund. Oberweis Micro-Cap goes all the way down the company size spectrum to invest roughly two-thirds of its portfolio in “micro-caps,” the smallest of the publicly traded companies. (Another third is primarily invested in merely “small” companies.) Micro-caps can be volatile, but when they work, they can add value, as evidenced by the +75% return OBMCX has posted over the past year. That compares to +23.7% for the S&P 500 Index, and that outperformance has pushed longer-term returns for this fund above the index over all longer-term time-frames out to 20 years.
Here is the performance of the alternative funds in June (2)
Real Asset Allocation (RAA)* + 3.11%
JP Morgan Equity Premium (JEPI)** - 1.92%
SummerHaven Dynamic Commodity (SDCI)*** - 1.89%
*All portfolio allocations hold RAA
**All portfolio allocations except for Aggressive hold JEPI
***Aggressive Growth allocations hold SDCI
REFERENCES
1. Morningstar May 31, 2026 Monthly Returns.
DISCLOSURES
The analysis and commentary in this Market Commentary is general in nature and does not take your personal circumstances into consideration. It is not intended to be a substitute for specific, individualized financial advice and investors should obtain legal, accounting and tax advice from a qualified tax professional, accountant or attorney.
The information provided in this Market Commentary, including any strategies, methodologies, and opinions, is expressed as of the date hereof and is subject to change. EverSource Wealth Advisors, LLC assumes no obligation to update or otherwise revise these materials.
This Market Commentary relies upon historical data, and much of the information presented is not intended to be performance reporting or representation, whether hypothetical or actual. Reports on the performance of various strategies are gross, not net, and do not take into account our fee or various third-party charges such as trading charges. Individual Exchange Traded Fund (ETF) performance in the commentary are monthly returns of all ETFs utilized across client accounts in various asset allocation percentages based upon risk tolerance. They are gross returns and not net of advisory fees. Each client’s returns will vary based upon the percentage of each ETF held, in addition to other variables, such as: allocations to money market funds, additional individual stocks or mutual funds held, and date of entry into each holding.
Actual results will vary from the analysis. Past performance should not be taken as an indication or guarantee of future performance, and no representation or warranty, expressed or implied is made regarding future performance or the accuracy of the information herein.
This material is provided for informational purposes, is intended for your use only, does not constitute an invitation, solicitation, or offer to subscribe for or purchase any of the products or services mentioned. It is likewise not a recommendation that you purchase, sell, or hold any security or other investment or pursue any investment style or strategy.